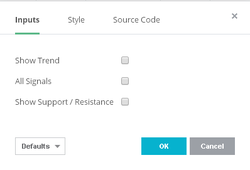
You may choose settings that suit your trading style.
Show Trend - highlights uptrend and downtrend with high RSI marked as dark green and low RSI as dark red color bars.
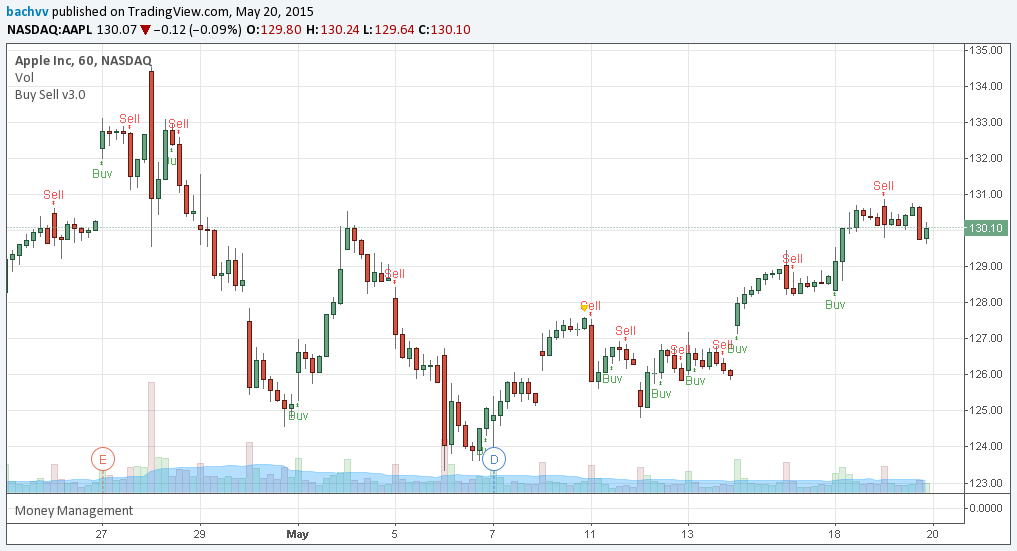
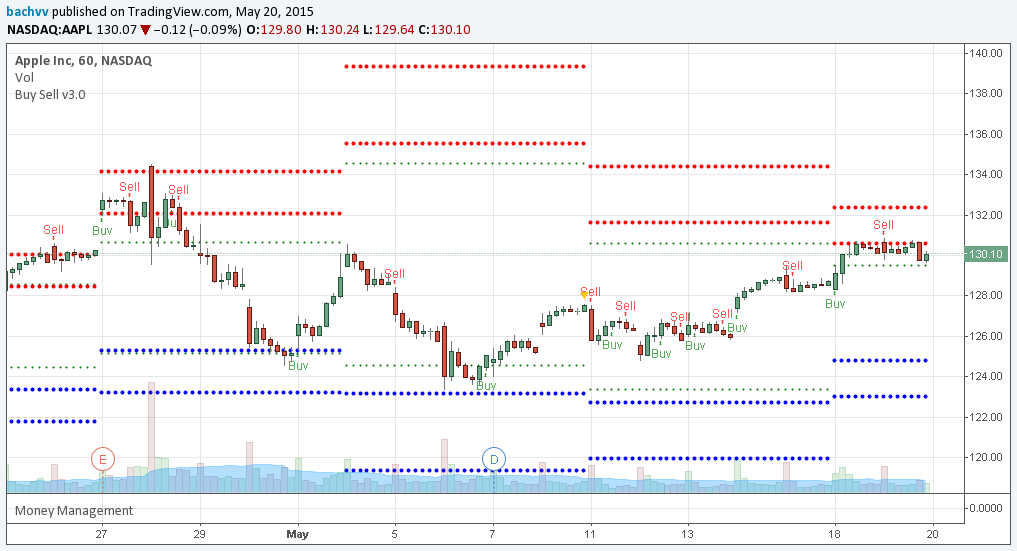
All Signals - show all potential Buy and Sell signals.
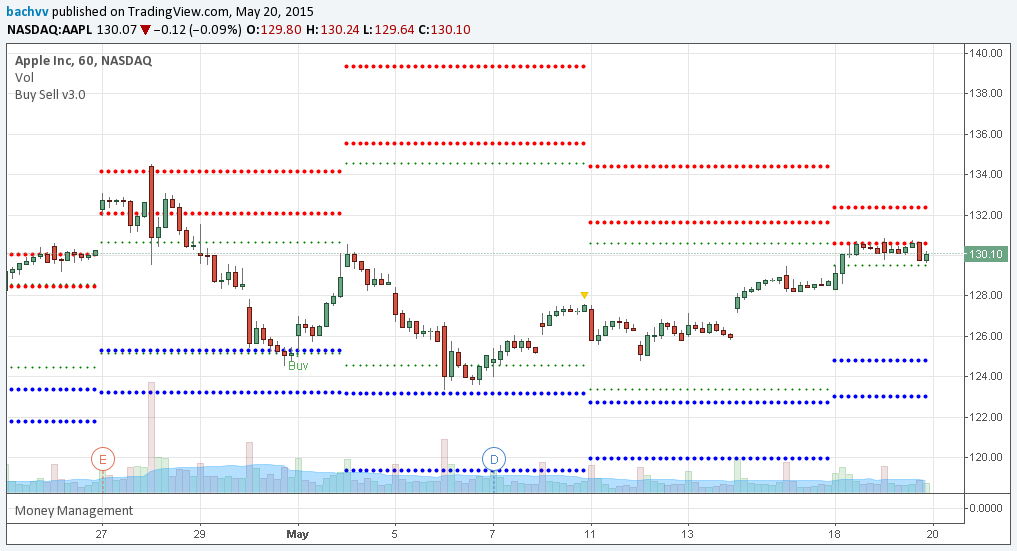
Show Support and Resistance - draws S&R levels so you don't need to do it manually.
Please take look at Synergy Trading indicators add-on in Trading View website to use our trading system.
Show Trend - highlights uptrend and downtrend with high RSI marked as dark green and low RSI as dark red color bars.
All Signals - show all potential Buy and Sell signals.
Show Support and Resistance - draws S&R levels so you don't need to do it manually.
Please take look at Synergy Trading indicators add-on in Trading View website to use our trading system.
Strategy |
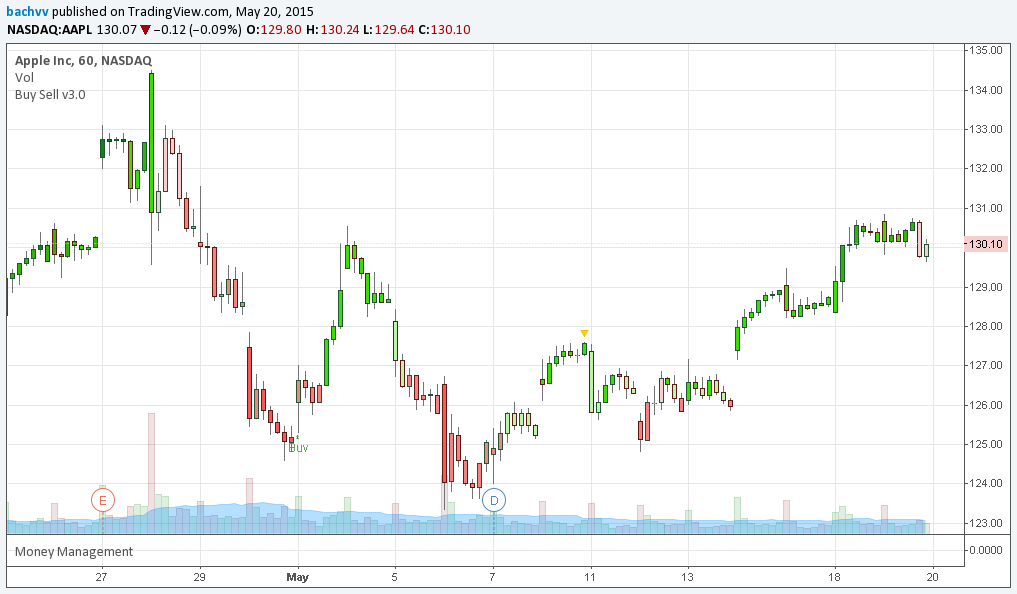
Suggested strategy is to Buy or go Long at Support level 2 or 3 (blue lines) and Sell or Short at Resistance level 2 or 3 (red lines). Green lines also are support and resistance but not so importance like blue and red. You may look at stocks that has price around Support and Resistance levels on daily chart and then spot for the Buy or Sell signals at hourly and 10 minutes chart to make your entry more precise and timely.
By default system will filter best signal for you so you don't need to look at S&R, trend and all signals. |
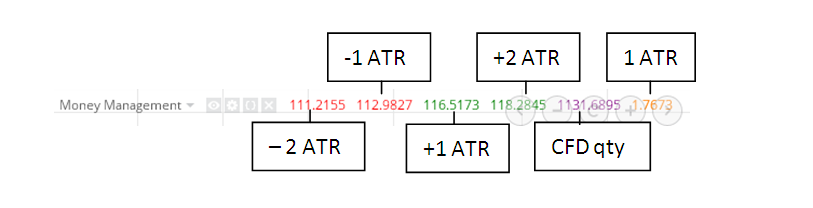
Money Management
We suggest you to put Stop Loss 1 daily ATR (average true range) far from Support or Resistance level that near your trade and Take Profit 2 ATR far. You may also take partial profit 1 ATR far from Support or Resistance and move Stop Loss to break even point, your entry point. We provide this indicator free of charge when you subscribe to Buy Sell indicator.